English
 عربى
عربى हिंदी
हिंदीFluid End Maintenance Cost: Reduce Parts Spend and Downtime
Jan 03, 2026
Content
- 1 What Fluid End Maintenance Cost Really Includes
- 2 The Operational Variables That Move Cost the Most
- 3 Component-by-Component: Where Spend and Downtime Usually Come From
- 4 High-Leverage Upgrades That Reduce Cost per Pumping Hour
- 5 Fluid End Material and Design Choices That Reduce Lifetime Cost
- 6 Maintenance Practices That Lower Cost Without Increasing Risk
- 7 Spares Strategy: How Lead Time and Interchangeability Affect Maintenance Cost
- 8 Repair vs Replace: Making the Decision Without Guesswork
- 9 A Practical Cost-Reduction Plan You Can Implement Immediately
“Fluid end maintenance cost” is rarely just the price of parts. For high-pressure fracturing and plunger pump duty, the real cost is the combination of consumables, labor, logistics, and—most importantly—lost pumping time when a changeout forces an unplanned stop.
From a manufacturer’s perspective, the fastest path to reducing fluid end maintenance cost is to identify which components create the most downtime per dollar, then attack the root causes: wear mechanisms (erosion/abrasion), pressure cycling, and sealing integrity. The second lever is procurement strategy—standardizing interchangeable spares and shortening lead times so downtime does not compound.
Below is a practical framework you can use to build a maintenance cost forecast and implement changes that reduce total cost of ownership without compromising safety.
What Fluid End Maintenance Cost Really Includes
Most maintenance budgets under-estimate costs because they only count consumables. A complete estimate should separate “planned” and “unplanned” events, and explicitly price downtime. Even if your accounting system does not book downtime as a “maintenance cost,” it is the driver that decides which design or material choice is truly economical.
| Cost Element | What It Covers | How to Measure Consistently |
|---|---|---|
| Planned parts | Seats, valves, packing, seals, covers, fasteners replaced on schedule | Parts per pumping hour (or per stage) by pump model |
| Unplanned parts | Emergency replacements, collateral damage (e.g., seat failure damaging the pocket) | Failure-mode log tied to work orders |
| Labor | Technician hours for changeouts, inspection, pressure testing | Standard job times per task (seat swap, packing swap, cover removal) |
| Downtime (opportunity cost) | Lost pumping time, standby spread costs, delayed stages | Hours down × internal value per pumping hour |
| Logistics & inventory | Expedite freight, stockouts, carrying cost, wrong-part returns | Fill rate, lead time, and inventory turns by SKU |
A useful rule of thumb: if you cannot explain why two fleets with the same pump model have different downtime hours per 1,000 pumping hours, the cost model is missing an operational variable (fluid chemistry, proppant loading, pressure cycling, filtration, or training).
The Operational Variables That Move Cost the Most
Fluid ends fail predictably when operating conditions exceed what the wear surfaces and seals can tolerate. Before changing suppliers or redesigning maintenance intervals, quantify the duty cycle with a few metrics you can track per job.
Pressure, cycling, and spikes
High-pressure pumping is not just “high pressure”—it is cyclic pressure. Even published performance tables for common frac pump configurations reference pressures up to 20,000 psi in certain operating points, which illustrates why fatigue and micro-cracking become cost drivers, not exceptions.
- Track average pressure and the frequency of pressure spikes (events, not just averages).
- Record strokes per minute (SPM) bands; higher SPM accelerates packing wear and heat build-up.
- Log abrupt starts/stops and suction-side upsets (a common precursor to valve/seat damage).
Abrasives, corrosion, and fluid chemistry
Erosion and abrasion dominate valve train and seat pocket wear, while corrosion (including chloride and acidic exposure) can shorten the service life of both the fluid end and sealing components. This is where material selection becomes a direct lever on fluid end maintenance cost—especially if your jobs include high-salinity water, aggressive chemistries, or persistent sand production.
If you want a quick diagnostic: compare two sets of jobs with similar pressure and SPM, but different fluid sources. If parts life drops sharply with one water source, you likely have a chemistry or filtration issue rather than a supplier issue.
Component-by-Component: Where Spend and Downtime Usually Come From
In most fleets, a small set of components determines the majority of interventions. The practical approach is to focus on the “maintenance frequency × downtime per event” items first. For reference, the fluid end parts in a typical hydraulic end are often grouped by function (sealing, core working parts, and connection/fastening), which maps directly to how they fail and what they cost to maintain.
| Component | Typical Wear Mechanism | Maintenance Action That Reduces Cost | Why It Matters to Total Cost |
|---|---|---|---|
| Valves & seats | Abrasive wear, impact, seat pocket erosion | Upgrade wear surfaces; control suction conditions; standardize changeout criteria | High event frequency; failure can create collateral damage and longer downtime |
| Packing & dynamic seals | Heat + friction, loosened packing nut threads, extrusion | Locking/retention methods; match packing material to fluid; align plungers | Frequent interventions; small part cost but meaningful downtime |
| Plungers | Surface wear, scoring, corrosion pitting | Improve fluid cleanliness; verify lubrication and alignment; inspect finish | Direct link to packing life; can drive cascading seal failures |
| Covers, flanges, fasteners | Fatigue, improper torque, sealing surface damage | Torque discipline; replace damaged sealing faces early; keep correct spares | Lower frequency but high risk; failures can force extended shutdowns |
If your work orders do not specify failure modes, add simple codes (abrasion, corrosion, fatigue, installation/torque, unknown). Within a few weeks, you can identify whether your maintenance cost is primarily operational, procedural, or design-driven.
High-Leverage Upgrades That Reduce Cost per Pumping Hour
Not every “premium” feature lowers fluid end maintenance cost. The upgrades that consistently pay back are those that reduce intervention frequency or shorten the intervention time. Below are two examples of design and material choices that directly target dominant wear mechanisms.
Valve body & seat wear surfaces
Seat life is often the gating factor for planned maintenance. Designs that improve the valve/seat contact mechanics and protect the base material from erosion can materially reduce interventions. For example, tungsten-carbide–coated seat surfaces are commonly used to raise compressive strength and reduce pressure-bearing wear. In field comparisons, it is not unusual to see statements of 5× (and in some cases up to 10×) longer normal working time versus conventional seats, depending on fluid abrasiveness and operating discipline.
If you want to explore component options, see frac pump valve body and seats specifications and wear-surface approaches.
Packing retention and dynamic sealing stability
Packing can fail “early” when packing nut threads loosen and create gaps that accelerate wear—particularly under high-frequency reciprocating conditions. Practical countermeasures include locking devices that stabilize the packing cap/nut and prevent progressive loosening. In addition, offering multiple packing materials helps match seals to chemical exposure and temperature, which reduces premature replacement.
For a parts-level reference, review frac pump packing seals options where retention design and interchangeability are emphasized.
Illustrative downtime math (how upgrades translate into cost)
To evaluate whether an upgrade reduces fluid end maintenance cost, compare cost per pumping hour, not purchase price. Here is a simple illustrative example (adjust the variables to your own fleet):
- Assume conventional seats require changeout every 40 pumping hours; upgraded seats last 200 hours (5×).
- Over 400 pumping hours, that is 10 events vs 2 events.
- If each event causes 2 hours of downtime, total downtime falls from 20 hours to 4 hours.
- If you value pumping time at $X per hour, the avoided downtime value is 16 × $X—often larger than the incremental part price.
This is the logic procurement teams can use to justify higher durability parts when they genuinely reduce interventions and prevent collateral damage.
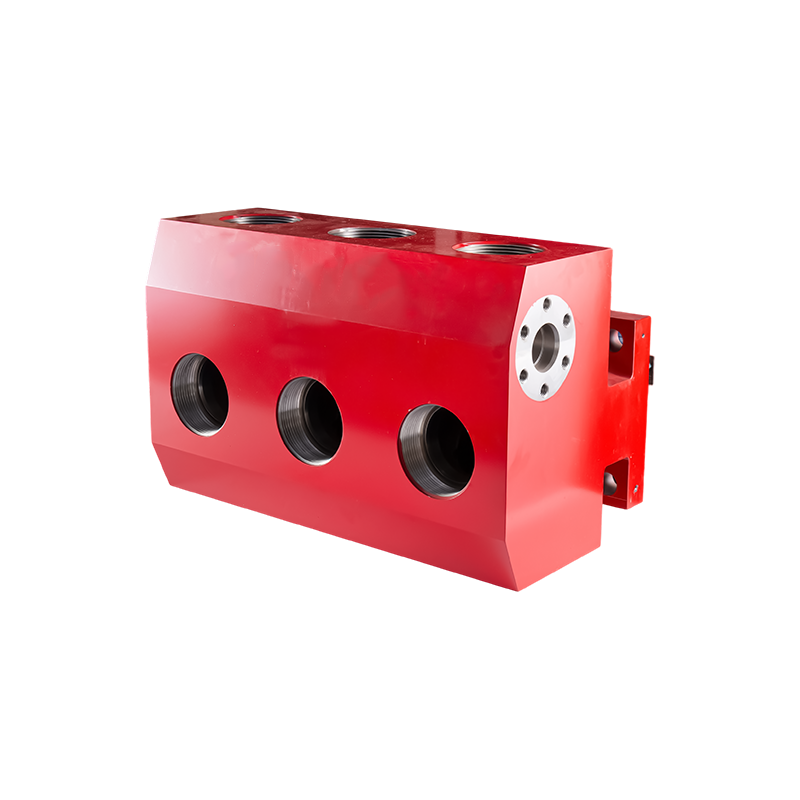
Fluid End Material and Design Choices That Reduce Lifetime Cost
The fluid end block and internal geometry determine how well the system tolerates pressure cycling, corrosion, and erosive flow. Material selection is the most visible decision, but design details (cavity geometry and stress management) often decide whether you get predictable wear or unpredictable cracking.
Stainless vs alloy: evaluate cost per life, not cost per block
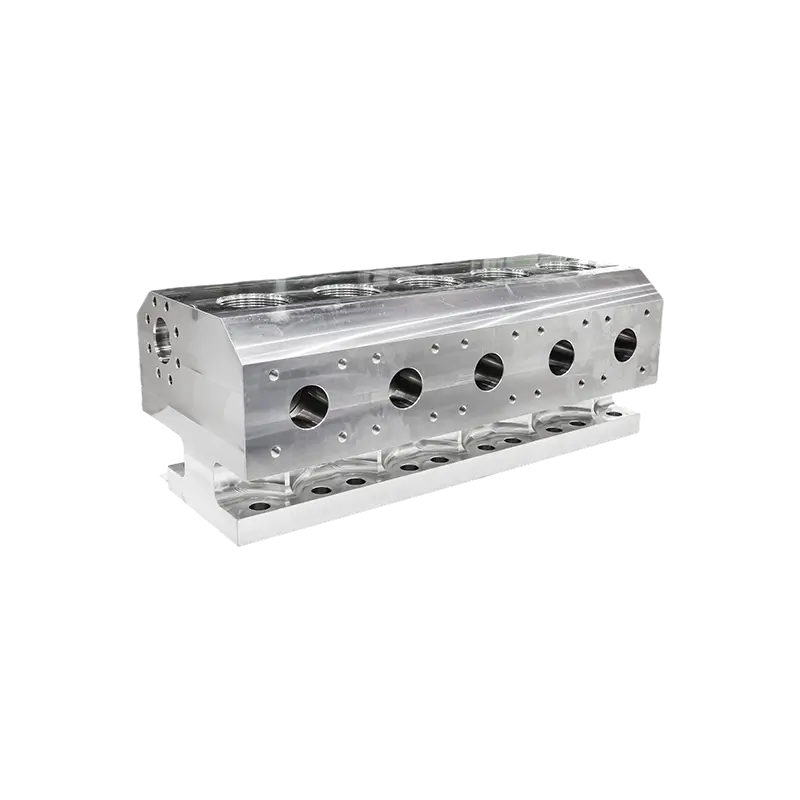
In corrosive or high-erosion duty, stainless options can reduce fluid end maintenance cost by extending service life and smoothing wear patterns. Some stainless fluid end configurations are published as achieving over 4× service life at roughly half the cost-per-life compared with alloy steel, even when raw material price is higher, because replacement frequency and downtime drop sharply.
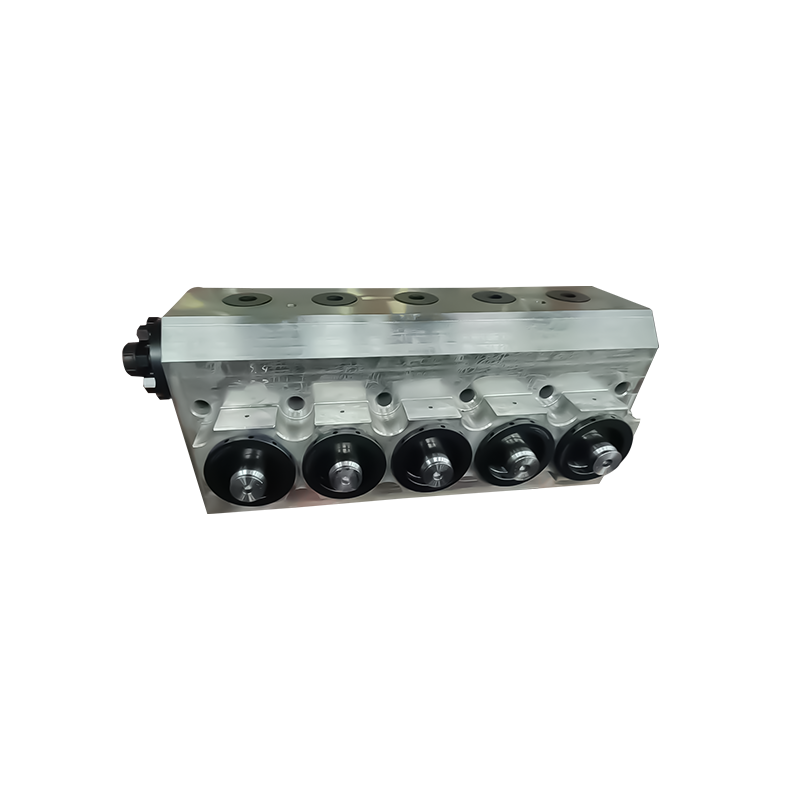
For example, the QWS2500 stainless steel fluid end is positioned around single-piece forging/heat treatment, optimized internal cavity structure, and material pairing across critical components (valve body, seat, plunger) to extend service life. The same design philosophy applies across the stainless steel fluid ends range where corrosion and erosion resistance are primary objectives.
Manufacturing controls that prevent early-life failures
When a fluid end fails “too early,” the cost spike is usually driven by unplanned downtime and collateral damage, not the part itself. Controls that reduce variability—such as stable forging grain structure, disciplined heat treatment, and consistent material quality—help avoid the high-cost tail of early failures. Published production approaches for high-pressure fluid ends often reference high-tonnage forging, single-piece heat treatment, and microstructure control (such as ferrite limits in certain stainless grades) to deliver repeatable performance.
If your maintenance cost is volatile across identical pumps, that is usually a sign of variability (installation, fluid conditions, or component quality). The fix is standardization: standard torque procedures, standardized parts, and a clearer pass/fail criterion for wear parts.
Maintenance Practices That Lower Cost Without Increasing Risk
The lowest-cost maintenance strategy is not “extend intervals until something fails.” It is a disciplined program that replaces the right parts before they cause collateral damage. The checklist below focuses on preventing the failures that create the longest downtime and the most expensive follow-on work.
Practical inspection checklist
- Each shift: suction stability check, abnormal vibration/noise check, leak walkdown, temperature trend check near packing areas.
- Daily: verify fastener torque discipline for covers/flanges (use documented torque values, not “feel”); inspect visible sealing faces.
- Weekly (or per job cycle): inspect valves/seats for impact marks and unusual wear; inspect plunger surface condition and alignment indicators; review spike events in pressure data.
- Planned teardown interval: inspect pockets and mating surfaces for erosion; replace any component that risks damaging the block if it fails during the next run.
Standardize “changeout criteria” to avoid arguments in the field
Ambiguous criteria (“looks worn”) increases cost because it causes inconsistent decisions: some crews change too early (higher parts cost), others too late (higher downtime and collateral damage). Define measurable triggers such as leakage rate thresholds, seat contact pattern acceptance, packing extrusion indicators, and plunger surface condition limits.
Spares Strategy: How Lead Time and Interchangeability Affect Maintenance Cost
A common reason fluid end maintenance cost inflates is not technical—it is logistical. When the correct part is not available, the crew improvises, or the pump waits. Either outcome is expensive. The lowest total cost usually comes from standardizing a short list of interchangeable parts and ensuring high fill-rate availability.
What to standardize first
- High-frequency wear parts: valves, seats, packing/seals.
- Failure-prone connection items: key fasteners, caps, and sealing rings.
- Model-aligned kits: one kit per pump model that matches your most common configurations.
Supplier capabilities that reduce downtime risk
From a supplier qualification standpoint, it is reasonable to ask about production capacity, inspection capability, certifications, and distribution footprint. Manufacturers that operate dedicated machining/heat treatment/testing areas and maintain international distribution capacity can reduce downtime risk by improving part consistency and shortening delivery time. In practice, shorter lead times and better availability reduce the “hidden” logistics portion of fluid end maintenance cost.
If you are consolidating vendors, prioritize suppliers that can provide both complete assemblies and critical wear parts, so your spares strategy is coherent rather than fragmented across multiple part numbers and quality standards.
Repair vs Replace: Making the Decision Without Guesswork
Some failures are inexpensive if caught early, while others should trigger immediate replacement decisions to avoid escalating downtime and safety risk. Use a structured decision approach rather than judgment calls under time pressure.
When repair is often economical
- Wear is localized to replaceable components (seats, valves, seals) and mating surfaces remain within tolerance.
- No evidence of block cracking, severe pocket washout, or recurring leaks after correct installation.
- Your historical data shows predictable life and stable downtime per event.
When replacement is usually the lower-cost decision
- Evidence of progressive cracking or deformation in high-stress regions (risk of sudden failure).
- Repeated pocket erosion that causes recurring seat failures (collateral damage pattern).
- Downtime is dominated by troubleshooting and rework rather than straightforward swaps.
If you are planning a replacement, align that decision with your spares strategy so the replacement fluid end integrates cleanly with the wear-part kits you already stock.
A Practical Cost-Reduction Plan You Can Implement Immediately
To reduce fluid end maintenance cost in a way that survives real operations, combine operational discipline with parts standardization. The steps below are designed to produce measurable results in weeks—not quarters.
Stabilize and measure (first 2–4 weeks)
- Define a single unit of measure (cost per pumping hour or per stage) and require every work order to log failure mode.
- Standardize torque and installation procedures; audit one crew per week for compliance.
- Create a minimum spares kit for the highest-frequency wear items to prevent stockout-driven downtime.
Target the highest downtime drivers (month 2)
- If valve/seat events dominate: evaluate upgraded wear surfaces and verify suction stability; consider seat designs with proven extended working time.
- If packing events dominate: implement retention/locking countermeasures and ensure plunger condition/alignment checks are enforced.
- If corrosion/erosion drives variability: evaluate stainless fluid end options and align packing materials to chemistry exposure.
Consolidate and standardize (month 3)
Once you have stable failure-mode data, you can consolidate SKUs and lock in standardized kits. This reduces procurement errors and improves fill rates, lowering logistics-driven maintenance cost. It also makes it easier to qualify suppliers based on consistent specifications rather than one-off emergencies.
If you need a single place to reference assemblies and wear components together, the product catalog of fluid ends and fluid end parts is a practical starting point for mapping your pump models to interchangeable spares.
Bottom line: fluid end maintenance cost comes down when you reduce intervention frequency, prevent collateral damage, and eliminate logistics-driven downtime. The best results come from pairing disciplined operating practices with durability-focused component choices and a standardized spares program.